Probability of Detection (PoD) curves are widely used to evaluate methane measurement technologies, particularly for OGI cameras. However, their effectiveness as a standalone metric for continuous monitoring (CM) systems is limited. This article argues for a more comprehensive evaluation approach that includes operational efficiency and real-world accuracy.
By Alex Alex MacGregor, CEO – Qube Technologies Inc. and Ben Montgomery, Sr Marketing Analyst – Qube Technologies Inc.
Probability of Detection (PoD) curves are an accepted metric to evaluate the detection capabilities of methane measurement technologies, measuring the likelihood of detecting leaks during controlled releases. This approach has commonly been used to assess the accuracy and precision of OGI cameras in real-world conditions. The role of continuous monitoring (CM) systems in environmental compliance and operational safety is expanding, driven by technological advancements and regulatory pressures.

The U.S. Environmental Protection Agency (EPA) acknowledges the advantage of these systems in detecting emissions swiftly and cost-effectively. However, the reliance on PoD as a standalone metric is increasingly seen as insufficient for evaluating system performance comprehensively. This article challenges the traditional reliance on PoD as the primary metric for assessing the effectiveness of CM systems in detecting fugitive emissions. Instead, it emphasizes a broader approach, considering factors that directly impact the operational efficiency and accuracy of these systems in real-world applications.
The Limitations of PoD in Continuous Monitoring
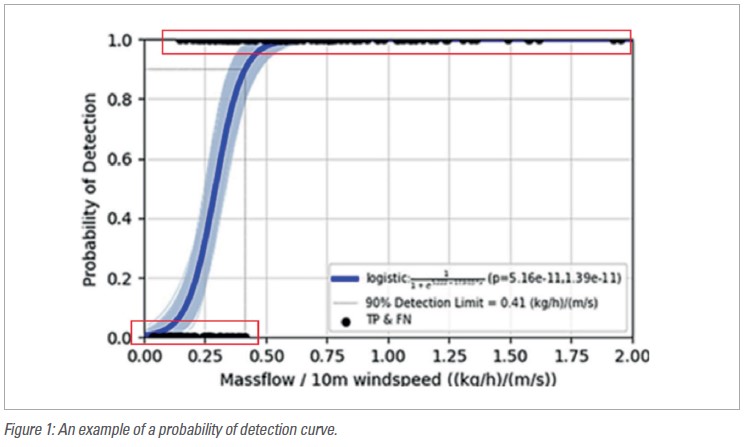
Probability of detection is often depicted as a function of emission rate and other predictor variables with a probability ‘curve’ or ‘surface’. The S-shaped sigmoid curve is the most common approach (Figure 1). At emission rates well below the sensitivity of a given solution, the PoD approaches 0 (left tail of the S). The right side of the S-curve should approach 1, meaning the detection is almost certain. The data points at 0.0 and 1.0 represent unsuccessful and successfully detected releases, respectively. The probability of detecting a release at any given rate is represented by the blue curve. Traditionally, as the emission rate increases, so does the PoD.
Probability of detection is a valuable indicator of a sensor’s sensitivity. However, it falls short in capturing the full scope of system performance under varying conditions. It does not consider factors such as environmental variabilities, installation discrepancies, or the dynamic nature of emission sources, all of which can significantly impact detection accuracy. The PoD metric is logical to characterize the performance of intermittent methane measurement technologies.
It is especially important to understand a technology’s detection capabilities if it is only making a single observation over a short duration on an infrequent basis. For example, consider a company operating under regulations requiring four surveys per year, as is the case in many jurisdictions.1,2 If flares are unlit 3-5% of the time, and each survey occurs over a single day, the probability of observing an unlit flare during a quarterly survey is roughly 0.054%.3 Hence, a high PoD is critical for intermittent technologies, as infrequent data collection increases the likelihood of missing leaks.
Intermittent technologies are not impacted by this problem in which a single observation is made, and the results are binary – either it is successful at detecting emissions, or it is not. In contrast, for continuous monitoring technology, the PoD metric does not capture the primary benefit of the technology, which is to provide temporal coverage.

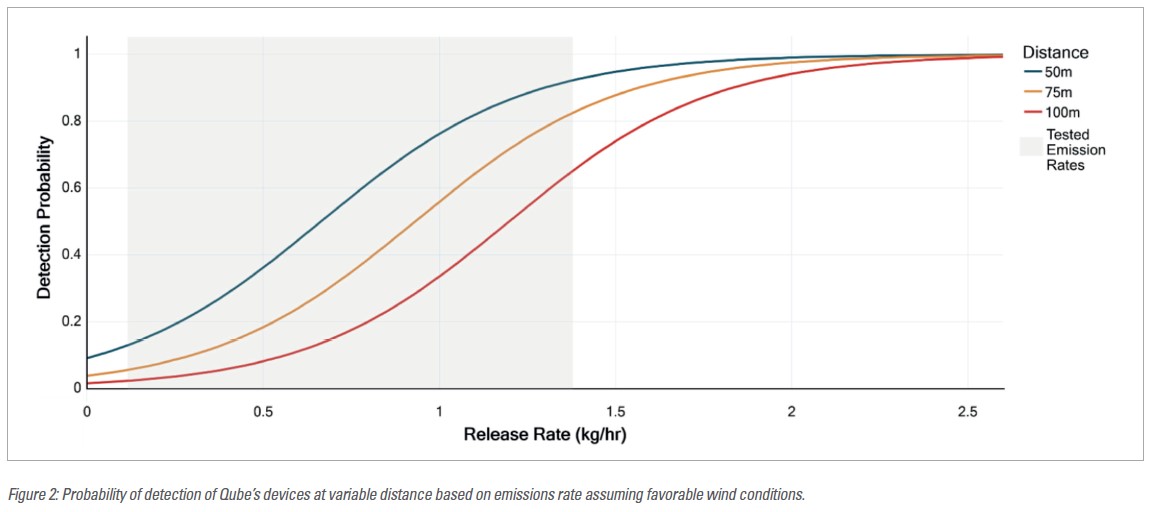
For example, Qube has participated in numerous studies characterizing the technology’s PoD.4 One thing remains consistent: the PoD has never converged to a single curve or value for a 90% PoD. Figure 2 shows an example of this; the three probability of detection curves were developed as part of a 3rd party blind test, where methane was released from a point source with rates ranging from 0.1-1.38 kg/h. Each release lasted for 40 minutes, and concentric rings of the devices were placed 50, 75, and 100 meters from the release point.
As visualized in Figure 2, each distance resulted in a unique PoD curve from the same set of releases. The varied results pose new questions regarding the efficacy of PoD, since it is designed to be a statistical measure of a technology’s detection capabilities. For CM, the system’s PoD for a long enough leak is equal to its minimum detection limit. Given that for an average facility the system makes about ~25 million measurements per year, it would make sense that the PoD of each measurement becomes less important for overall detection.

The PoD curve shown in Figure 2 also implies that the devices detect leaks of greater than 2.5 kg/h 100% of the time. Many emissions are not persistent. For example, some are short one-off events (compressor blowdowns), some are intermittent but reoccur (historically where the company has identified the largest emission reductions), and other leaks are persistent. However, regardless of the nature of the emission, the PoD curve implies that if the emission size is greater than the technologies 100% PoD, the device will always measure it. This is not always the case. The devices will only measure what the sensors detect, and the algorithm infers and as such the metric is misleading.
For shorter emissions, determining a CM system’s PoD is more complicated and requires an understanding of wind variability and observability. Observability refers to whether a monitoring device is downwind of a leak source at a specific time. Not every molecule of gas above the method detection limit (MDL) will be detected at the fence line, but one can still infer the general start and end times of an event if there is periodic availability.
Think of a continuous monitoring system as a panning security camera; in the same way that a security camera may miss an event when it pans away, the continuous monitoring system may miss portions of emissions when the wind changes directions. Observability and wind variability determine how effective a CM system can bound and quantify an event. A smart CM system should have the ability to revisit and correct detected emission rates across the full duration of the event, even during periods of low observability.5 However, the longer and more frequent the plume crosses a device, the more confidence in its quantified rate and bounds.

Continuous emissions monitoring technology has evolved significantly in recent years, but the metrics to evaluate it have lagged. While PoD is useful, the industry must adopt more accurate metrics. Specifically, improved techniques should account for the temporal coverages that these systems provide (i.e., fit for purpose). Metrics that account for observability and wind variability are needed but given that there is not a generally accepted metric at this time, detection time and MDL and significantly better ways of evaluating continuous monitoring systems. By integrating a more comprehensive range of performance metrics, stakeholders can achieve a more accurate and reliable assessment of technology, fostering better environmental protection and operational efficiency.
Conclusion
As regulations evolve, regulators must have an informed understanding of what performance metrics mean for different types of emissions measurement. The EPA’s OOOOb rule for continuous monitors provides an example of appropriate metrics.6 The rule requires a minimum detection limit of 0.4 kg/hr as opposed to a PoD. The focus is on measuring whether a leak is severe relative to the background levels of methane at a particular facility. Putting the OOOOb rule into context with short-duration controlled releases, the 7-day action level for a non-wellhead only facility is 21 kg/h.
There is little practical significance for the ability to identify and isolate a 20-minute-lonng trial release at 2.5 kg/h when the requirement is to quantify the 21 kg/h rate over the full 7-day rolling average period. To put it in perspective, that trial release would only amount to 0.83 kg vs the 3,528 kg required for the 7-day action level. As CM systems evolve, incorporating metrics that account for temporal coverage, wind variability, and observability will be crucial in achieving more accurate detection and quantification of methane emissions, paving the way for both technological innovation and enhanced environmental stewardship.
REFERENCES
- Directive 060: Upstream Petroleum Industry Flaring, Incinerating, and Venting. Alberta Energy Regulator (2022). https://www.aer.ca/regulating-development/rules-and-directives/directives/directive-060
- Subpart OOOOa – Standards of Performance for Crude Oil and Natural Gas Facilities for Which Construction, Modification or Reconstruction Commenced AfterSeptember 18, 2015 and On or Before December 6, 2022. (2024) 81 FR 35898 https://www.ecfr.gov/current/title-40/chapter-I/subchapter-C/part-60/subpart-OOOOa
- Plant, G., Kort, E. A., Brandt, A. R., Chen, Y., Fordice, G., Gorchov Negron, A. M., Schwietzke, S., Smith, M., & Zavala-Araiza, D. (2022). Inefficient and unlit natural gas flares both emit large quantities of methane. Science, 377(6614), 1566-1571. https://doi.org/10.1126/ science.abq0385
- Moorhouse, B., Palma, B., Fox, T. (2022) Qube Technologies Continuous Monitoring Probability of Detection: Results from independent single-blind controlled release testing (White Paper) Highwood Emissions management. https://highwoodemissions.com/wp-content/uploads/2022/09/2022-08-25_Qube-Probability-of-Detection-White-Paper.pdf
- Roger, B. (2022). Enhancing Emission Metrics with Qube’s Accurate Emission Rate https://www.qubeiot.com/resources-news/beyond-site-rate
- Subpart OOOOb – Standards of Performance for Crude Oil and Natural Gas Facilities for which Construction, Modification or Reconstruction Commenced After December 6, 2022. (2024). https://www.epa.gov/system/files/documents/2022-11/8510_OilandGasClimate_OOOObRegText_Supplemental_20221005.pdf


