

What are GHGs?
Greenhouse gases (GHGs) are gases that absorb and emit radiant energy, within the thermal infrared range, that cause the ‘greenhouse effect’ (envision a greenhouse for plants, fruits, and vegetables). The primary GHGs in our Earth’s atmosphere are water vapor (H2O), carbon dioxide (CO2), methane (CH4), nitrous oxide (N2O), and ozone (O3). Greenhouse gases are not bad by nature. Without greenhouse gases, the average temperature of Earth’s surface would be about -18 °C (0 °F) rather than the present average of 15 °C (59 °F).
Greenhouse gases are generated from nature and mankind also known as anthropogenic GHGs. The key anthropogenic (man made) GHGs of focus are carbon dioxide (CO2), methane (CH4), and nitrous oxide (N2O).
Sources of GHGs
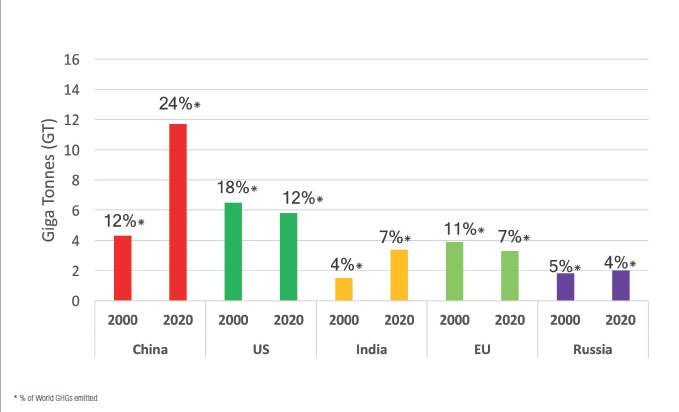
In 2000, see Figure 2, the top 5 countries/regions emitted ~50% of the World’s GHGs. (US, China, the EU, Russia, India).
In 2020, these same 5 countries/regions emitted ~54% of the World’s GHGs (China, US, India, the EU, Russia) which included a doubling of China’s & India’s share of the total and approximately 1/3 reductions in both the US and the EU’s share of the total.
Figure 3 shows the contribution (in %) of the key sources of GHGs for China, the US, the EU, India, Russia, and the rest of the world countries. As can be seen from the data, there is not one common solution to mitigate all GHGs. There will need to be a host of mitigation tactics across each source of GHGs.
In most countries/regions GHGs from electricity & heat (power) generation is the largest source, while the 2nd largest source varies by country/region. However, mitigating GHGs from power generation will address 25%-50% of the world GHG emissions.
Figure 4 uses the same data from Figure 3 but shows the contributions (in %) of GHGs from China, the US, India, the EU, Russia, and the rest of the world (ROW) for each of the key sources of GHGs. This provides a look at the country/region with the largest impact on each of the key sources of GHGs.
From this view, the greatest opportunity for GHG reductions is in the key sources:
• Power Generation (Elect/Heat) –China
• Agriculture – Globally
• Transportation – Globally
• Industrial Operations (Industry) –China
• Buildings – Globally
• Fugitives – China, Russia
Opportunities for GHG reduction in each of the key sources (Heat/Elect, Agriculture, Transport, Industry, Buildings & Fugitives) are addressed in the following paragraphs.

Change in World GHGs emissions from 2000 to 2020 – top 5 Countries/Regions
Power Generation (Elect / Heat)
With approximately 32% of the World GHGs coming from power consumption (elect/heat) improving energy efficiency (energy per unit GDP) should be a national priority among all countries.
By 2050, power consumption (elect/heat) is forecasted to increase by 50%, equivalent to adding 7 Billion metric tonnes of GHG (assuming current power generation GHG emission rate), which includes a nearly tenfold increase in wind and solar energy generation (50 million GWh).
Options to reduce power generation emissions of GHGs include changing high GHG emitting feedstocks (coal, oil) to lower or no GHG emitting feed-stocks (natural gas, wind, solar, nuclear, hydro). However, the lower or no GHG sources of power generation have limitations.
“Intermittent” power generation from renewable solar & wind sources do not produce power 24/7/365. To ensure reliable power 24/7/365 additional sources of power (batteries, natural gas, etc.) are needed to supplement wind & solar sources.
“Intermittent” power generation from solar & wind requires a lot of land. Nearly 5,000-10,000 acres per Giga-watt (~3-6 hrs peak sun per day) are required for solar generation and approximately 50,000-80,000 acres per Gigawatt (~6 hrs peak wind per day) for wind generation.
Read Part 2 of this article in the June 2022 issue of Fugitive Emissions Journal to learn about the other three primary sources of GHGs.
Percent of Country / Region GHGs emitted – by Source

Percent of World GHGs emitted – by Country/Region & Source


REFERENCES:
1. China, India, Japan, Russia, United States | Total including LUCF | Greenhouse Gas (GHG) Emissions | Climate Watch (climatewatchdata.org); European Union (27), World | Total including LUCF | Greenhouse Gas (GHG) Emissions | Climate Watch (climatewatchdata.org)
2. International Energy Agency.
ABOUT THE AUTHOR
With 38 years of experience in the energy industry, Tim Goedeker, Senior Principal Environmental Consultant for Phillips 66, knows the value of experience and the importance of innovation. Starting his career as a Process Engineer in the oil refining sector and moving into the environmental side of the business, Tim has a vast knowledge and understanding of this ever evolving industry.