

By A. Geramifard A, C. Pappas A, M. Gyawali A, R. Aryal B.
A. San Jacinto College, South Campus, 13735 Beamer Rd, Houston, TX 77089,
B. Franklin Pierce University, 40 University Dr, Rindge, NH 03461
Since the early 2000s, air quality has been a highly investigated topic among researchers and the general population. This has prompted states to look at new, unique ways of studying this complex issue. When discussing air quality, it is important to bear in mind that air is a homogenous mixture (mixes evenly). The air we breathe daily contains many elements that are hard to distinguish and are often undetectable. Dry air contains 78.09% nitrogen, 20.95% oxygen, 0.93% argon, 0.04% carbon dioxide and small amounts of other gases. Nitrogen oxides (NOx), mainly nitric oxide (NO), are produced from high-temperature combustion, such as when fuel is burned in motor vehicles and power plants. Once emitted, NO is oxidized in the atmosphere rapidly to form NO2. Some nitrogen dioxide is formed naturally in the atmosphere by lightning and through plants, soil and water.
Nitrogen monoxide (NO) and nitrogen dioxide (NO2) are both jointly referred to as NOx. Nitrogen dioxide is a highly reactive and unpleasant-smelling gas. NO2 is used as the indicator for the larger group of nitrogen oxides which primarily enters the air through fossil fuel combustion as described above. Other sources of NO2 include petrol and manufacturing industries, as well as food processing. These are all widely sought-after trades in Texas, as the state is well-known for oil extraction, large imports and mass production facilities in both the upstream and downstream markets.
Increased levels of NO2 can pose threats on both human health and environmental safety. According to epa.gov breathing in this gas can cause irritation of the lungs which can lead to asthma. Prolonged exposure to NO2 can lead to respiratory infections, which can damage the lungs. Furthermore, NOx reacts with other chemicals in the atmosphere to form ozone and particulate matter. Ozone can further damage the lungs, causing chest pain, coughing, shortness of breath, and throat irritation. Nitrate particles that result from NOx interact with water, oxygen and other chemicals in the atmosphere to produce acid rain. Acid rain harms animals, plants, water, and other things in lake and forest ecosystems. The nitrate particles that result from NOx makes the air hazy and difficult to see through in urban environments, as well as residual nutrient pollution in coastal environments can kill fish, oysters, and other aquatic animals.
Methodology, Results, and Discussion
This study analyzed multi-year (2005-2018) nitrogen dioxide (NO2), trends over six major cities: Houston, San Antonio, Dallas, Austin, Galveston, and El Paso, Texas, USA. We retrieved NO2 measurements from an ozone measuring instrument (OMI)2, 3 abroad the Aura satellite and compare with in situ surface NO2 measurements from U.S. Environmental Protection Agency (EPA) Air Quality System (AQS) network. We then analyzed NO2 trends observed by the two measurement systems and examined how the implementation of pollution control and technological advancements reflected in NO2 observations. Finally, we presented the multiyear, 2005-2018, time series analysis of OMI and EPA measurements over Houston, Texas.
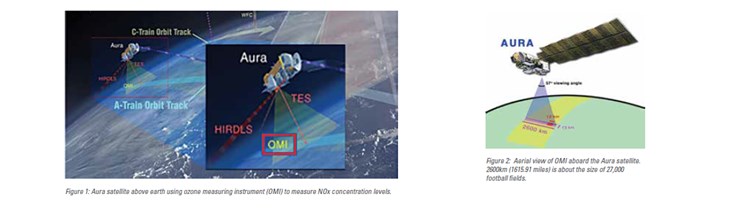
The Aura satellite passes over the United States, Figure 1, once a day in the early afternoon from 1:00pm- 2:00pm Center time, therefore OMI readings were only be made during this hour-long time frame. During
this period, the OMI took count of the amount of NOx concentration that lay within a certain area. A more in depth aerial view of the of OMI is seen in Figure 2.
EPA monitors measure the surface level NO2 concentration continuously. The EPA NO2 concentrations are expressed in PPB (parts per billion) and are measured with a technique called ‘chemiluminescence’, a chemical reaction that emits light energy. EPA monitors are placed throughout the country, as shown in Figure 3. The EPA ground based NO2 measurements were extracted from each available monitor using the EPA website: aqs.epa.gov. After the data was extracted, an average was taken from each of the monitors in six cities across Texas. To compare with the NASA satellite data, the EPA ground-based data was averaged for 1:00pm-2:00pm. The EPA data is important not only as another form of measurement, but also to see how accurate the OMI data was in comparison.
The model Figure 4 was the extracted data from OMI. The scale on the right indicates how many molecules occupy one square centimeter of space. The more NO2 molecules that are in a square column of space, the lower the air quality. The two major cities during 2005 that had high levels of NO2 include Houston and Dallas, respectively. Even between the two cities, there are above average levels of NO2. As the years progressed, a decreasing trend occurred in those areas specifically, and air quality slightly improved in parts of west Texas as well. The likely culprit of the above average NO2 over Houston and Dallas would be due to the large amount of imports and visitors they receive year-round when compared to the rest of Texas.
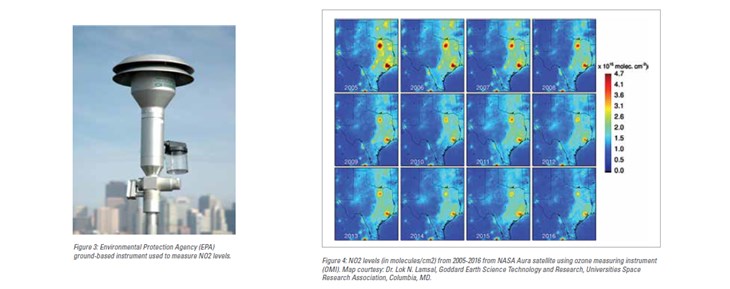
Figure 5 indicates the time series plot where the OMI and EPA data was compared for the city of Houston. The red lines indicate OMI measurements like the ones demonstrated in Figure 4, while the blue lines represent EPA ground measurements. The time series shows that the EPA and OMI data are quite similar. This implies that the satellite data remains consistent with the ground data, thus making our overall data consistent. The time series analysis also indicates that the NO2 levels are slowly but surely falling in both surface and above sea level in the state of Texas. Finally, both EPA and OMI measurements confirm that there has been approximately a 40% to 44 % decrease in NO2 levels in the city of Houston from January 2005 to April 2018. Similar analysis on the remaining cities (not shown in Figure 5) follow the same trend of decreasing O2 levels. This is mainly due to the advancement of technologies and industrial regulations, supporting the implementation of tighter emission standards and the development and promotion of alternative fuels.

Conclusion
In this research, NO2 levels from both OMI and EPA measurement systems are analyzed and compared. Both EPA and OMI measurements indicate that NO2 levels decreased substantially in the past decade in several major Texas cities. With the increase in technological advancement and emission control devices, companies in Texas are cracking down on NO2 levels in the air. Improved regulations and technology are important because as Texas implements new strategies to improve air quality, it can propagate and prevent the transport of NO2 to other states as well. So, although everything is “Bigger in Texas”, NO2 levels will not be one of them.
References
1. US Environmental Protection Agency. Air Quality System Data Mart [internet database] available via
https://www.epa.gov/airdata. Accessed 08/20/, 2018.
2. Duncan, B. N., L. N. Lamsal, A. M. Thompson, Y. Yoshida, Z. Lu, D. G. Streets, M. M. Hurwitz, and K. E. Pickering (2016), A space-based, high-resolution view of notable changes in urban NOx pollution around the world (2005–2014), J. Geophys. Res. Atmos., 121, 976–996, doi:10.1002/ 2015JD024121.
3. Lamsal, L. N., B. N. Duncan, Y. Yoshida, N. A. Krotkov, K. E. Pickering, D. G. Streets, and Z. Lu (2015), U.S. NO2 trends (2005–2013): EPA Air Quality System (AQS) data versus improved observations from the Ozone Monitoring Instrument (OMI), Atmos. Environ., 110, 130–143, doi:10.1016/j.atmosenv.2015.03.055.
About the Authors
Dr. Madhu Gyawali is a professor of Physics at San Jacinto College, 13735 Beamer Rd, Houston, TX 77089. Dr. Gyawali has completed his Ph.D. in Physics from the University of Nevada, Reno. His work focuses on ambient air quality studies. Dr. Gyawali has also participated in the planning, fieldwork, and data analysis of several major air quality studies, and has published his articles in many peer-reviewed scientific journals.
Arjang Geramifard started at San Jacinto College and currently attends The University of Houston Clear Lake. He is a predental biology major as a full-time student. He presented this research in Valve World Conference 2019 in Downtown Houston at George R. Brown Convention Center. Geramifard helped in writing and researching for this research article.
Christian Pappas currently attends San Jacinto College and is a dual credit student who also attends Clear Horizons Early college high school as a full-time student. Christian is one of the authors who helped in writing and researching for this research article. Christian has also helped in explaining and researching other topics related to STEM such as Thermodynamics, Batteries & Voltage, and robotic arms for people in wheelchairs.
Dr. Rudra Aryal is a professor of Physics at Franklin Pierce University, Rindge, NH. Dr. Aryal has completed his Ph.D. in Physics from the University of Miami, Coral Gables in 2012. His work focuses on the study of aerosol optical properties over the atmosphere and long-range transportation of air pollution and has published his articles in many peer-reviewed scientific journals.