Emissions mitigation is recognized as a crucial part of environmental management, and emissions monitoring programs have long been implemented to address community air quality concerns. The regulatory environment has guided corporations in managing environmental matters for several decades. However, increasing concern globally for the environment and the effects of climate change have sparked greater urgency to reduce emissions, with multiple initiatives targeting net-zero emissions by 2050. As a result, it is increasingly apparent that simple compliance with current regulations will not satisfy either shareholders or the public.
By Michelle Liu, EIT, M.Eng., and Dennis Prince, CEO, P.Eng., M.Sc., Airdar Inc.
Nonetheless, the detection of emissions and measurement of this valuable data remains challenging due to the inherent uncertainty around identifying emission sources. Emissions are variable in nature and can occur in unexpected locations, making them difficult to predict even in the most sophisticated environments. Removing this uncertainty requires an approach that provides broad coverage and monitoring in an undirected or unbiased manner. Continuous monitoring sensors can overcome the challenges of managing fugitive emissions by monitoring an entire facility for suspected and unsuspected emission sources. Several types of available sensors are able to capture ambient concentration measurements of a target compound, and can be arranged individually or in an array (network) to provide the desired coverage and data granularity.
In theory, measurements taken continuously can provide data that allows leaks to be detected earlier and repairs to be made sooner. While accurate data collection is a necessary first step, the real power of continuous monitoring data is derived from its analysis. Through a series of proprietary analysis steps, concentration and wind data can be analyzed over time, identifying valuable patterns. These patterns not only increase location accuracy but can facilitate the differentiation between offsite and onsite sources, identify emissions coming from elevated sources, observe topography effects on plumes, and determine when sensors require calibration.
This proprietary approach has widespread applications, as identification of locations and quantification of emission sources can be performed for any detectable compound. This analysis can be updated in near real-time to provide timely information on new and abnormal emission events.
Transforming Concentration Data
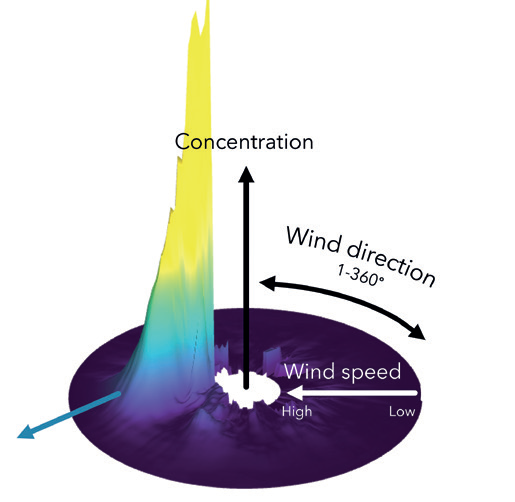
Concentration data collected continuously from sensors can be visualized as shown in Figure 1. Here, concentrations or flux are plotted on the vertical axis and values increase going up the axis. Wind direction is plotted around the radial surface with the northern direction at 0° (360°). Wind speed is plotted along the radius of the surface and increases moving toward the center.
Plumes from several emission sources can be observed in Figure 1, with one plume being significantly prominent. It is important to note that these visualizations are dimensionless, and the size of the plume observed on the radial surface does not necessarily correlate with the size of the actual emission source. Determining the actual size requires factoring in the distance from the observation point to the emission source.
Offsite vs. Onsite Sources
Plumes from an offsite emission source can impact a site and cause confusion for even experienced operators, especially in the case of odorous emissions such as those caused by hydrogen sulphide (H2S). The ability to differentiate between offsite and onsite emission sources is a valuable tool in identifying and attributing emissions to the right source. This allows for the selection of the most appropriate mitigation strategy and effectively directs existing resources to the right issue.
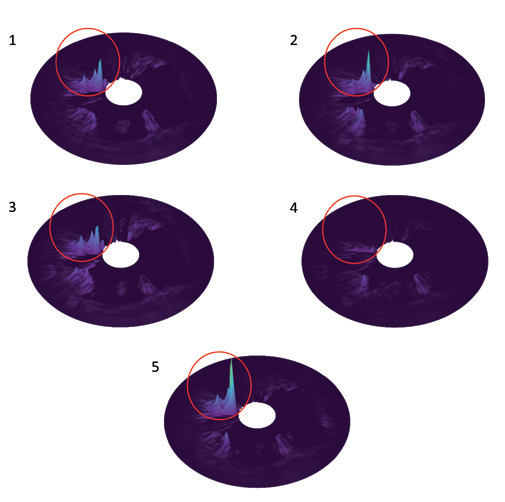
A source located onsite will likely be amongst the sensors in a network. For onsite sources, a plume is observed by one or a few of the sensors but may not be observed by all the sensors in the network. Therefore, plumes will only be seen in the radial surfaces of some of the observation locations. The plume from the source will appear in different wind directions on the radial surface of each monitoring location.
Offsite sources are large relative to onsite sources and the offsite source will have a similar impact on a well-distributed array of point sensors. For an array of point sensors or monitoring locations in an area, an offsite source impacting a facility may exist when similar plumes are found in the same region of each radial surface for each monitoring location as shown in Figure 2. Here, all five radial surfaces show indications of a plume coming from 280°. Given a plume is observed in this direction from each of the five sensors, this is a strong indication that an offsite source is impacting these sensors.

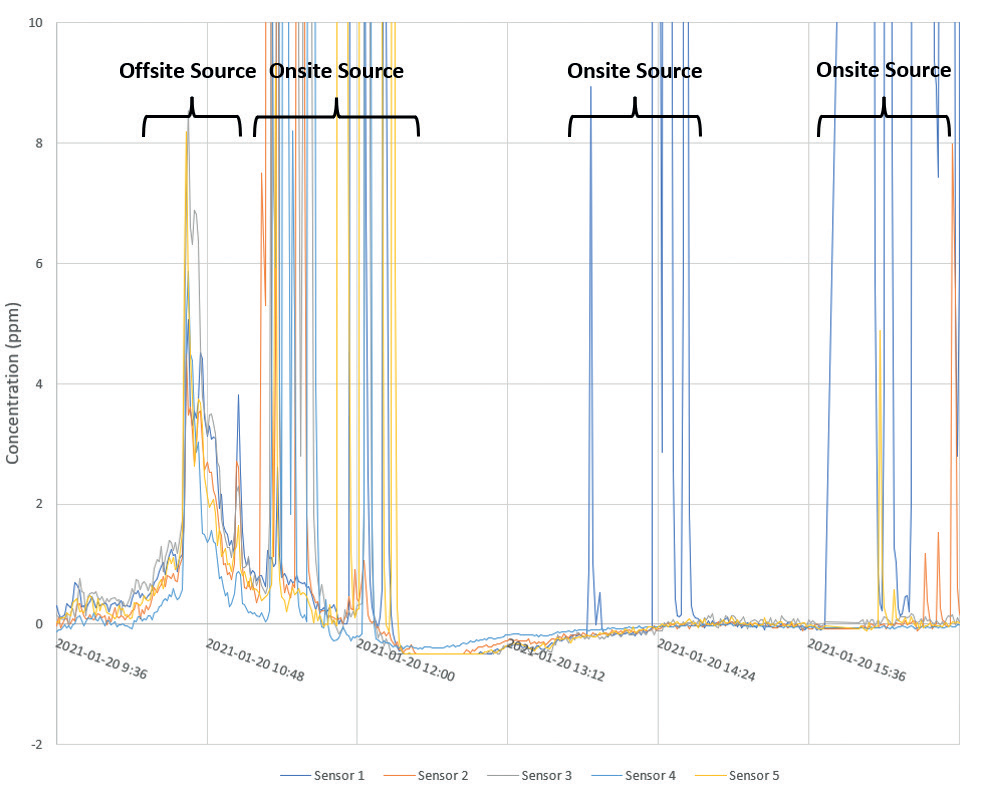
The presence of both offsite and onsite sources can also be seen in plots of concentration over time, as shown in Figure 3. When concentration spikes are seen by all sensors, this is an indication of an offsite source. However, when a spike in concentration is observed in only some of the sensors, this could potentially indicate that an onsite source is being detected by those sensors.
Elevated Plumes
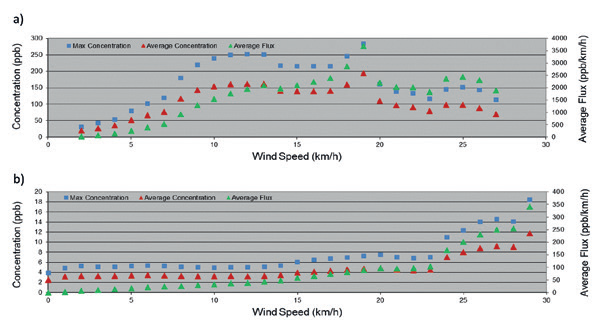
Plumes emitted from a source will become diluted with ambient air and disperse outward as the plumes travel downwind. With this knowledge, emission plumes coming from an elevated source, such as a gas flare, stack or from a source located closer to ground level are distinguishable and identifiable in air concentration patterns. Figure 4 shows plots of the concentration and flux of plumes over increasing wind speed. If the concentration or flux values reach a maximum and starts to decrease at higher wind speeds as shown in Figure 4a, this is an indication that the emission source is near ground level or at the same level as the sensor. In Figure 4b, concentration and flux values continue to increase as wind speed increases. This indicates that the full extent of the plume has not been captured by this monitoring sensor and that only the bottom portion of the plume is being detected.


The visualization of the data introduced earlier in Figure 1 shows a prominent sulphur dioxide (SO2) plume with a pattern indicating that it is coming from an elevated emission source. Concentration values increase as wind speed increases moving toward the center of the radial surface. The plume detected shown in this visualization is coming from a stack source.
Distinguishing elevated sources is important as the influence of emissions from these sources may not be immediately evident or experienced by operators at the site, especially in the case of odours. Plumes from an elevated source can remain at elevation over the site, but then settle offsite in the surrounding area. Surveys using periodic, ground-level approaches such as handheld monitors, optical gas imaging (OGI) cameras, or Auditory Visual Olfactory (AVO) inspections may miss unsuspected emission sources that are elevated. In this circumstance, it is possible that a nearby community would experience a greater proportion of emissions than those experienced by monitoring sensors located within or at the fence line of a facility.
Topography Effects
The physical features around a site and the location of the wind monitor have an impact on the plumes that are obtained. The topography can affect the movement of the wind in transporting emission plumes to the sensors. These topography effects are evident in visualizations of the plume as the trajectory of the plume has been observed to shift by a few degrees between higher and lower wind speeds, as shown in Figure 5. At lower wind speeds, there is more wind swirling as the plume is being deflected off obstructions and is less forceful. At higher wind speeds, it settles to find the best path around the obstruction. Despite topography effects, the plume is visible in the data and can still be detected.



Calibration
Without visiting a site, patterns in the concentration data can be used to identify if a sensor in a network requires calibration. Known offsite sources can be used as a reference point for this purpose. Ideally, all sensors of a network should read approximately the same value while observing the same offsite plume. When a sensor shows noticeably different readings compared to other sensors in the network, this can be an indication that the sensor requires calibration or replacement.
In Figure 2, the radial surfaces show that Sensor 4 has a less prominent plume compared to the same plumes observed in the same region of the radial surfaces of the other four sensors. The chart in Figure 3 also shows Sensor 4 consistently measuring lower concentrations compared to the other sensors. These signs indicate that Sensor 4 may require calibration and should be further investigated.
Case Study: Edmonton Composting Facility
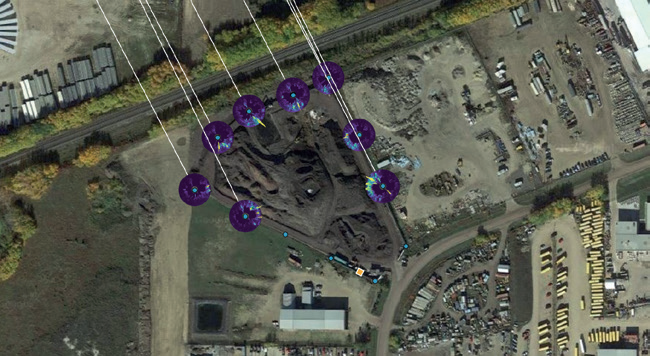
A case study is presented to demonstrate the practical applications that are possible with the information that can be found in patterns in the concentration data. Fugitive odour emissions are challenges frequently experienced by the composting industry. A composting facility in Edmonton was under pressure because of odour concerns expressed by the nearby community. However, other possible sources of odours were present in the vicinity, including a recycling facility, an oil and gas field, a large lake, and a wastewater lift station. The odours experienced by the surrounding neighbourhood were quickly attributed to the composting facility, but facility managers believed that other sources in the area were possible. A continuous monitoring system was installed to measure concentrations of H2S around the fence line of the composting facility. From the data collected, radial surfaces were obtained for each monitoring location. Radial surfaces for some of these monitoring locations are shown in Figure 6.
An analysis of the collected data identified two focal points of H2S emissions at the site. Given this information, the facility was able to make targeted interventions to reduce the odours coming from the two emission focal points. Additional monitoring was performed after the interventions, and an analysis of this data showed that the mitigation measures taken reduced onsite H2S emissions by 80%.
The system also identified a plume of H2S coming from the direction where several potential offsite emission sources were situated, which may further explain the odours being experienced in the community. These plumes are evident in the radial surfaces shown in Figure 6, where each radial surface contains a plume coming from the northwest direction. With this plume being observed by several monitoring locations, it was suspected that an offsite source was present. Upon further investigation, a stagnant waste collection line in a nearby industrial area was determined to be an important offsite emission source. At times, emission rates of H2S that were emitted from this source were as high as H2S emission rates coming from the composting facility.
An analysis of the patterns in the continuous monitoring data provided the composting facility with actionable information that allowed managers to improve their operations by understanding where important emission sources were located at their site. Targeted interventions that addressed the root of the issue could be implemented to greatly reduce H2S emissions coming from the site.
Conclusion
Valuable information is contained within ambient monitoring data. Using only concentration measurements, wind speed, and wind direction, a proprietary intelligent data analysis approach is available and can determine the locations of emission sources and their emission rates. Characteristics of the emission source can be seen in patterns in the data, which can be visualized through radial surfaces. Distinguishing between offsite and onsite sources as well as elevated sources, observing the impacts of local topography, and determining calibration requirements are all possible. Agnostic to the sensor, this approach has broad applications across various industries in providing valuable information to effectively detect and manage fugitive emissions at a site.


