By Gary Daves – TRICORD Consulting
On January 26, 2022, the EPA announced a new program to expand air monitoring capacity, utilizing assets such as the ASPECT airplane, GMAP mobile air monitoring vehicle, and additional air pollution inspectors to enhance enforcement. As part of the new monitoring program, it also recently conducted GMAP surveys at petroleum refineries and chemical plants along the Gulf Coast.
Mobile monitoring technologies such as the GMAP vehicle and ASPECT airplane can bring additional scrutiny to an industrial facility. Upon finding a potential problem through mobile monitoring assets, the EPA typically conducts an audit of the facility. Such in-depth EPA audits often result in enforcement actions that can cost millions of dollars in penalties and additional capital and operational costs for facilities. On the positive side, a screening survey that indicates no notable problems at a facility could result in the EPA focusing on other facilities where they did find issues. Facilities can prepare for these potential surveys and inspections through conducting their own additional monitoring, as discussed in this article.

The EPA’s “Multi-Scale Monitoring Project”
On January 26, 2022, the EPA also announced the Administrator had “Directed the Office of Enforcement and Compliance Assurance (OECA) to aggressively use its authority to conduct unannounced inspections at suspected non-compliant facilities.” A new “Multi-Scale Monitoring Project” was described as employing the EPA’s ASPECT airplane and mobile vehicles like GMAP to monitor industrial facilities’ air emissions, while, “A team of inspectors from across EPA regions will follow up to investigate any emission detection findings at specific sites.” As announced in January, the Multi-Scale Monitoring Project was launched in Spring 2022, conducting GMAP surveys at multiple facilities – petroleum refineries and chemical plants – along the Gulf Coast.

Technology
As indicated by the name, the new monitoring project is “multi-scale”, with an airplane providing monitoring from the sky and a vehicle providing mobile monitoring on the ground.
The Airborne Spectral Photometric Environmental Collection Technology (ASPECT) aircraft is based near Dallas, Texas, and according to the EPA is “Available 24/7/365 and can begin collecting data at any site in the continental U.S. within nine hours.” The ASPECT aircraft has “A suite of sensors and software that can generate data in a variety of formats to produce scientifically valid products within five minutes of data collection.” The ASPECT instruments most applicable for detecting typical chemical emissions from industrial facilities are the Infrared Line Scanner to image chemical plumes, and the High Speed Infrared Spectrometer, to identify and quantify the composition of the chemical plume in the ppb to ppm range. A fact sheet indicates “ASPECT uses the principles of remote passive infrared
detection via a Fourier Transform Infrared Spectrometer (FTS) to detect and quantify gaseous constituents present in the air column between the aircraft and the ground.” The sensors are combined with chemical detection software “Designed to filter out common atmospheric constituents as it automatically searches for 78 chemical compounds in near real-time,” in the air column below the aircraft, and “hundreds of other chemicals can be processed by the team post survey.”
While the ASPECT aircraft can employ its sensors to look for elevated emissions levels across large areas from altitudes of hundreds to thousands of feet, the GMAP vehicle can narrow the focus to smaller areas within an industrial facility or neighborhoods outside a facility’s fence line. Because state agencies, including the Texas Commission on Environmental Quality, have also acquired GMAP units, GMAP monitoring is likely to be much more common than industrial facility monitoring by the ASPECT aircraft. GMAP units also have an advantage over the ASPECT aircraft in that they can simultaneously collect ground-level samples for detailed laboratory analyses for a wide range of compounds while conducting mobile monitoring.
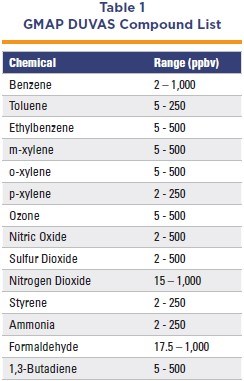
The EPA’s GMAP unit employs a DUVAS DV30 0 0 differential ultra-violet absorption spectrometer (DUVAS) which can detect several compounds in the parts per billion by volume (ppbv) range. Table 1 lists the DUVAS detectable compounds and the manufacturer’s specified range for each compound.
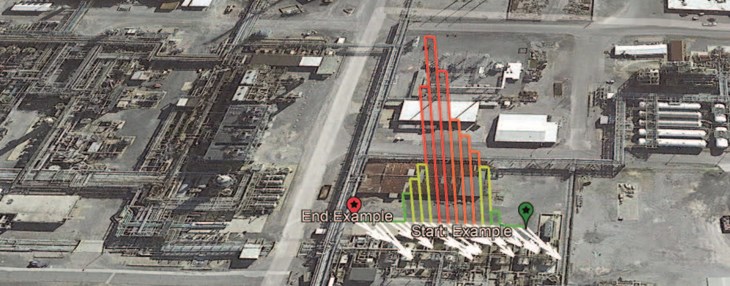
The data from the DUVAS “are integrated with global positioning system (GPS) location information and meteorological parameters, when available, under a common time stamp using the specially designed Mobile Emission Monitoring software to quantify air pollutant concentrations and source trajectories.” Figure 1 provides a simulated output as an example of the type of image that can be produced from DUVAS data and software. The image depicts the concentration of a measured compound indicated by bar graphs along the path of the GMAP vehicle with the simultaneous wind directions and speeds monitored for each depicted concentration.

Implications for Industrial Facilities
If a screening survey by the EPA or a state agency with a GMAP unit or other mobile monitoring indicates elevated concentrations, additional EPA scrutiny often results. Particularly of interest is whether the elevated concentrations are due to emissions from sources that are not in the facility’s air quality permit (e.g., previously unknown by the facility) or that have previously underestimated emissions levels. The additional scrutiny could include an in-depth EPA audit of a facility’s environmental compliance programs such as LDAR monitoring, air quality permitting and compliance, BWON, MACT, NSPS, and state air quality regulations.
If a facility is identified for an audit due to the EPA’s monitoring campaign, all the facility’s environmental programs are subject to audit. Therefore, regular environmental program reviews and additional monitoring are beneficial to minimize risk. In-depth EPA audits often result in enforcement actions that can cost millions of dollars in penalties and additional capital expenditures. Consent decrees from enforcement initiatives have also resulted in additional ongoing monitoring requirements at facilities, including continuous fence line monitoring, with a requirement to build a public website, and post the newly collected data every two weeks. Fenceline monitoring pursuant to the EPA’s Method 325A/B can cost on the order of $100,000 per year or more in laboratory analysis and labor costs, besides adding the liability of another environmental compliance program that previously was not required for the facility and bringing additional public scrutiny.

Preparing For The EPA’s Additional Monitoring
In response to EPA’s new monitoring initiative, facilities can proactively look for the types of issues that could be found through the GMAP and ASPECT surveys. Similar to the layered approach utilizing remote real-time sensors for detecting sources of elevated ambient chemical concentrations, industrial facilities can also utilize a layered approach to maximize their opportunities to find and proactively address potential issues.
For surveys both inside a facility as well as in the neighborhoods surrounding a facility, monitoring with units like GMAP is commercially available to industrial facilities.
Commercially available GMAP units can be utilized for:
- Fenceline Monitoring (FLM) support to identify unknown and/or underestimated emission sources,
- Differentiate competing emission sources between facility sources and/or third-party contributing sources,
- Pre-screen monitoring in preparation of planned agency GMAP monitoring,
- Comparative monitoring during agency GMAP monitoring,
- Support for negotiating Consent Decrees with FLM,
- Support of FLM studies and FLM program implementation,
- Routine supplemental monitoring (e.g., quarterly screening of equipment) as an enhancement to existing LDAR, BWON, FLM, and Community Relations Management programs,
- Baseline community monitoring, and,
- Rapid response remote air monitoring (e.g., offsite monitoring during an emission event).
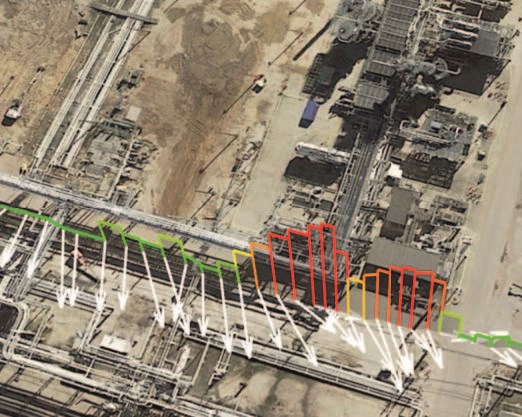
The results of GMAP surveys can be graphically depicted on aerial images of the facility, such as the simulated situation in Figure 2, to identify the locations of high concentrations and the wind direction and speeds associated with the monitored concentrations. Those graphical depictions can identify the area where the source of the elevated concentration is located, narrowing the focus to isolate the potential contributors from other sources at the facility. Upon determining the specific area of interest (e.g., a small portion of a tank farm, a particular area of a process unit, etc.), additional resources can be utilized to determine the exact emission point.
Once the focus has been narrowed to a small segment of the facility, additional technology and methods such as infrared (IR) cameras, handheld photoionization detectors (PIDs), and Method 21 LDAR monitoring, can be utilized to identify the individual emission source(s) contributing to the elevated concentrations found through the mobile monitoring. Some examples of issues found with GMAP surveys include line leaks at a tank farm pump station, elevated emissions from a large platformer compressor, and emissions from a benzene floating roof tank seal affecting the facility’s publicly reported benzene fence line monitoring concentrations.
Because conditions at an industrial facility change often, including emissions from some fugitive components increasing over time, some facilities are considering periodic GMAP surveys to proactively discover potential issues as early as possible. Additionally, and specifically related to fugitive emission sources such as valves, auditing your LDAR program, with auditors from both within and outside your organization, can help identify and correct gaps in the program that the EPA might discover on close evaluation. During audits, often comparative monitoring is conducted to evaluate the accuracy of the LDAR monitoring program at a facility.
Summary
The EPA’s increased use of mobile monitoring technology will result in more agency and public scrutiny on industrial facilities. However, companies can leverage the same technology the EPA uses to conduct baseline and periodic surveys at their facilities to proactively identify and remedy potential issues.
ABOUT THE AUTHOR
Gary Daves is a licensed professional engineer (Louisiana and Texas) with TRICORD Consulting, LLC. Gary has over 20 years of experience assisting petroleum refineries and chemical plants with air quality permitting and compliance requirements, including MACT, BWON, NSPS, and U.S. EPA Method 325 fenceline monitoring (FLM) requirements.
Acronym List
ASPECT – Airborne Spectral Photometric Environmental Collection Technology
BWON – Benzene Waste Organic NESHAP
CEMS – Continuous Emission Monitoring System
DUVAS – Differential Ultra-Violet Absorption Spectrometer
EPA – U.S. Environmental Protection Agency
FLM – Fence line Monitoring FTS – Fourier Transform Infrared Spectrometer
GMAP – Geospatial Measurement of Air Pollution GPS – Global Positioning System
IR – Infrared
LDAR – Leak Detection and Repair
MACT – Maximum Achievable Control Technology
NSPS – New Source Performance Standard
OECA – U.S. EPA’s Office of Enforcement and Compliance Assurance
PID – Photoionization Detector ppb – parts per billion
ppbv – parts per billion by volume ppm – parts per million


