U.S. state and federal regulation frameworks are transitioning from conventional methods (sniffers), to visualizing and detecting leaks using OGI cameras for leak detection and repair (LDAR) applications.
By Ram Hashmonay Sc.D., Chief Innovation Scientist, Opgal
The rising demand for quantifying leaks and emissions of methane and volatile organic compounds (VOCs), in terms of emission rate, raised the question of whether quantification-optical-gas-imaging (QOGI) software was capable of estimating emission rates remotely and accurately. This article describes, in detail, the science and calibration procedures of a quantification approach.
What is OGI?
GI technology has proven to be a handy tool for detecting and visualizing small gas leaks and more substantial fugitive emissions in petroleum refineries and related oil & gas industries. OGI technology was primarily portable, mid-wave infrared (MWIR), cryogenically cooled detector cameras, for imaging volatile organic compounds (VOCs). Since its inception in the early 2000s, the OGI technology gradually developed along with the regulatory process and acceptance. In recent years, there is a fast-track emergence of new OGI technologies, expanding the field of OGI technologies to the long-wave infrared (LWIR) uncooled detector cameras, to fixed installation OGI cameras with automated detection and quantification capabilities, and to drone-borne OGI surveys.
Physics Outside the OGI Camera
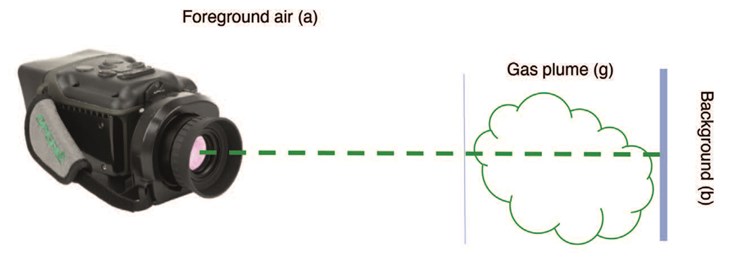
Figure 1 illustrates the “outside of the camera” physical principles of gas plume detection using OGI technology. Using a simplified 2-layer (background (b), gas plume (g), and foreground air (a) as depicted in Figure 1) radiative transfer model to describe the thermal radiance transferred from the background to the OGI camera. 1, 2, 3 Each layer in Figure 1, as in all bodies in nature, irradiates a temperature-dependent thermal electromagnetic radiation according to the black body Plank’s function.
The following Camera Specific OGI Equation considers the specific transmission of the camera’s optics. The camera’s optics (primarily bandpass filter) is key for compound specific response to different levels of integrated concentrations, CL. The contrast ΔI at each pixel in the OGI image between the thermal radiance with and without gas present in the line of sight is given:

Ino gas – integrated thermal radiance over the bandpass filter spectral range, on pixels with no gas.
Igas – integrated thermal radiance over the bandpass filter spectral range, on pixels with gas.
t(λ) – bandpass filter transmission as a function of wavelength.
I(T) – integrated Planck’s function over the bandpass filter spectral range.
τa – integrated foreground air transmission over the bandpass filter spectral range.
OGI Quantification
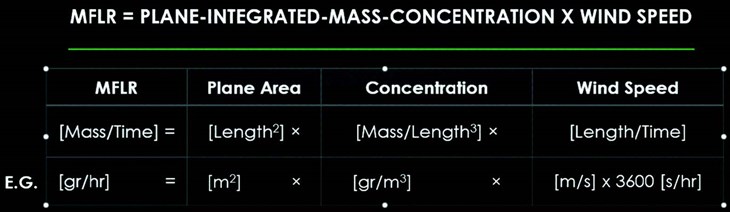
Quantifying concentration and leak rate values, based on OGI technology, is a complex and challenging task, that requires innovation and problem-solving skills in every step of the process. Recently, Opgal has developed special proprietary algorithms for accurately determining path integrated concentrations (PIC), or concentration-length (CL) for a pixel in the OGI image and mass flow leak rate (MFLR) for a series of acquired OGI images. In this original process, a new language of terms and set of equations had to be formulated. CL values are calculated as an intermediate stage for determining the target leak event’s average MFLR (equivalent to mass emission rate). Figure 2 describes the components, retrieved from an acquired series of OGI images, needed for determining the MFLR of a leak event.
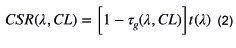
To calculate the CL for a line of pixels downwind from a leak, it is first needed to determine CL for each pixel in that line of pixels. Then, define from the camera specific OGI Equation (Eq. 1), the compound specific response spectrum, CRS(λ,CL):
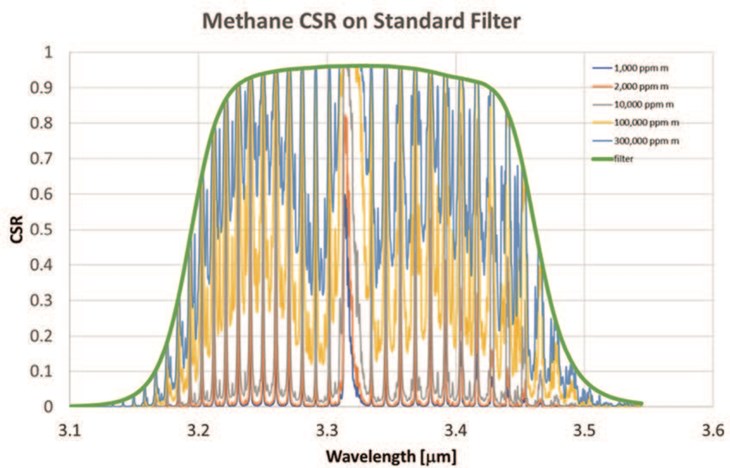
Figure 3 demonstrates the good match between the methane specific response spectrum and the camera standard filter (SF), for a wide range of CL values.
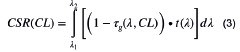
Unlike other OGI quantification software that uses response factors (RF) relative to propane response, an algorithm for determining CLs, based on compound specific response (CSR) function, CS-R(CL) has been developed. Integrating Equation 2 over the bandwidth of the filter, the CL dependent CSR function is defined as:
The software includes a very precise theoretical integration information of CSR function for each compound. This predetermined library of functions is calculated using very high-resolution absorption coefficient data from the Pacific Northeast National Laboratory (PNNL) infrared library, the EyeC-Gas2.0 Standard Filter transmission spectrum, and a proprietary theoretical calibration procedure. These functions’ behavior with CL values is specific for the absorption coefficient spectrum and bandwidth filter transmission.
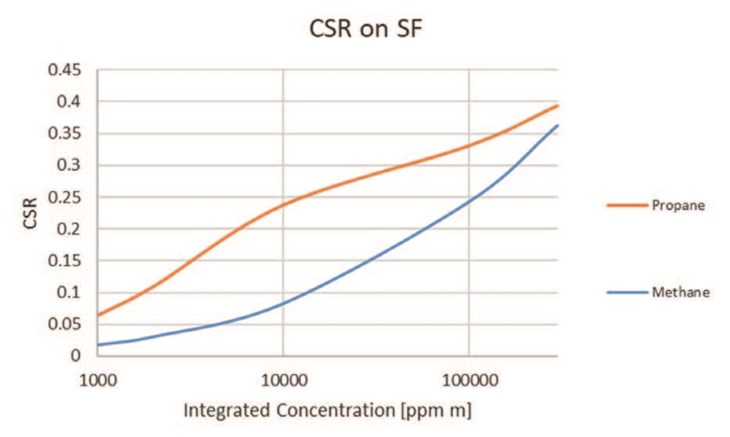
Figure 4 compares this behavior for propane and methane. It is apparent that this OGI camera is more sensitive to detecting propane than methane, and that these functions are not linear and are different for various compounds (logarithmic scale for the CL axis). Also, these functions are independent of the environmental scene (ΔT – temperature difference between background and air) and therefore are pre-calculated in Opgal’s software to serve as reference data for determining the CL from the acquired relative contrast for each pixel and each frame. Once a series of images (hundreds of frames) are collected for a target detected leak event, temperature dependent CSR values are acquired for each pixel in each frame. A prior knowledge of the leaking compound allows the algorithm, using the predetermined library of CSR functions, to calculate CL, typically in ppm m, for each pixel in each frame. It is important to note that this measured relative contrast is corrected by taking the ratio of the measured contrast and the foreground air transmission, τa , calculated for the specific atmospheric and dimension variables of the measurement scene.
The next step is the calculation of wind-speed by examining movement of the plume between frames. The last step is to integrate the CL over a line of pixels to estimate the plane-integrated concentration (See Figure 2) and multiply it by the retrieved windspeed to get a MFLR in mass per time units for each frame in the collected series of images. Taking the mean and standard deviation of all calculated leak rates of the series provides the average leak rate of the target leak event and the uncertainty associated with it.
Calibration Experiments
Researchers have performed an extensive series of calibration experiments to optimize CL measurement accuracy of CL measurement using the EyeCGas 2.0 OGI camera. Both the camera and a tunable diode laser absorption spectroscopy (TDLAS) remote methane leak detector (RMLD by Heath Consultants) were collocated and aimed at the same methane gas leak plume at several distances from the plume, as shown in Figure 5.
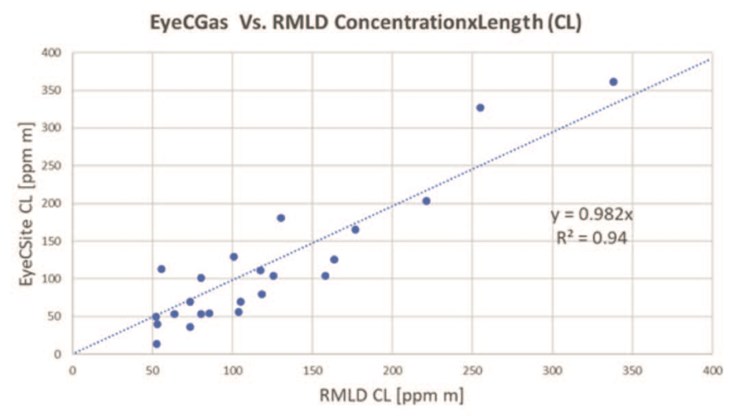
Figure 6 illustrates an example great correlation of CL values measured by both technologies for the same line of sight (a group of pixels at the approximated laser spot). It also demonstrates the high sensitivity of the EyeCGas 2.0 Camera, well below 100 ppm m at ΔT=20C.
Conclusion
The EyeCSite 2.0 QOGI software launched late last year and has participated in several third-party blind testing for intercomparison of bottom-up leak quantification technologies. In these studies, EyeCGas 2.0 and associated QOGI software, performed best for emission quantification, out of all bottom-up technologies, QOGI or not. Advancements in bottom-up quantification of fugitive emissions will continue with further technology, testing, and applications.
References
- Sharkov, Eugene A. Passive microwave remote sensing of the Earth: physical foundations. Springer Science & Business Media, 2003.
- Beer, Reinhard. Remote sensing by Fourier transform spectrometry. Vol. 170. John Wiley & Sons, 1992
- Flanigan, Dennis F. “Prediction of the limits of detection of hazardous vapors by passive infrared with the use of MODTRAN.” Applied Optics 35.30 (1996): 6090-6098