Growing concern about the threats of global warming attracts attention to greenhouse gas emission control. Natural gas consists of mainly methane, a gas with strong global warming potential. The oil & gas industry implements Leak Detection and Repair (LDAR) programs to curb uncontrolled methane emissions. There is a range of tools used for LDAR monitoring.
By Eugene Kolonsky, Ph.D.a, Semen Neverovb, Alexei Gribovc and Johan Wictord
Test Design and Results
The Goal of the Experiment
The goal of the experiment is to answer the following questions:
- How sensitive to leaks is TDL detector at the range of its working distances? In other words, what is the leak definition threshold in grams per hour (g/h), for which operator with TDL detector can reliably distinguish a leak (emission over the leak definition threshold) from a no-leak (emission lower the leak definition threshold or zero emission).
- What is the TDL detector readings threshold in ppm×m, corresponding to this leak definition threshold in g/h?
Equipment and Materials Used
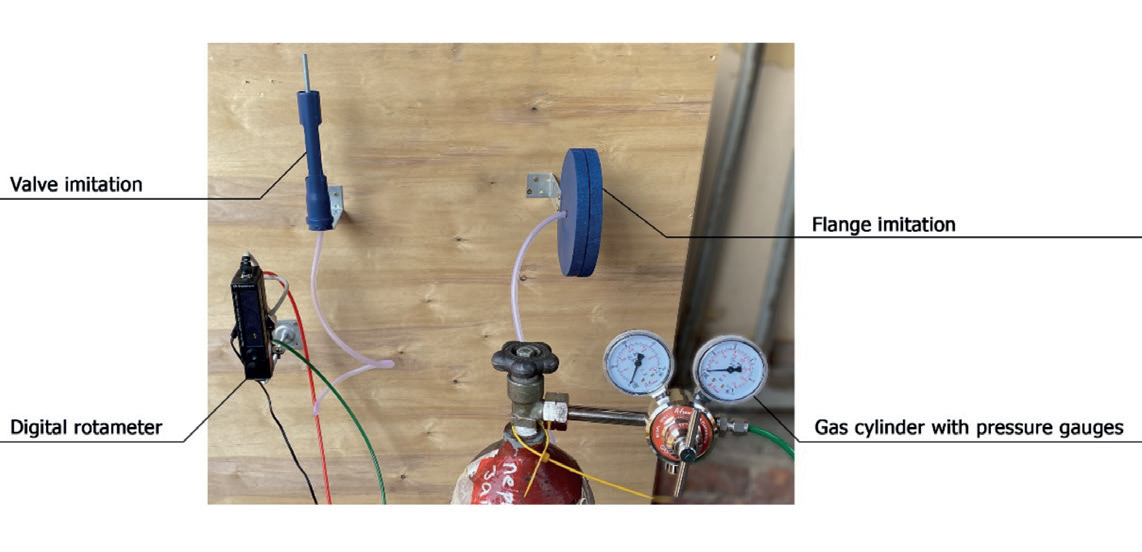
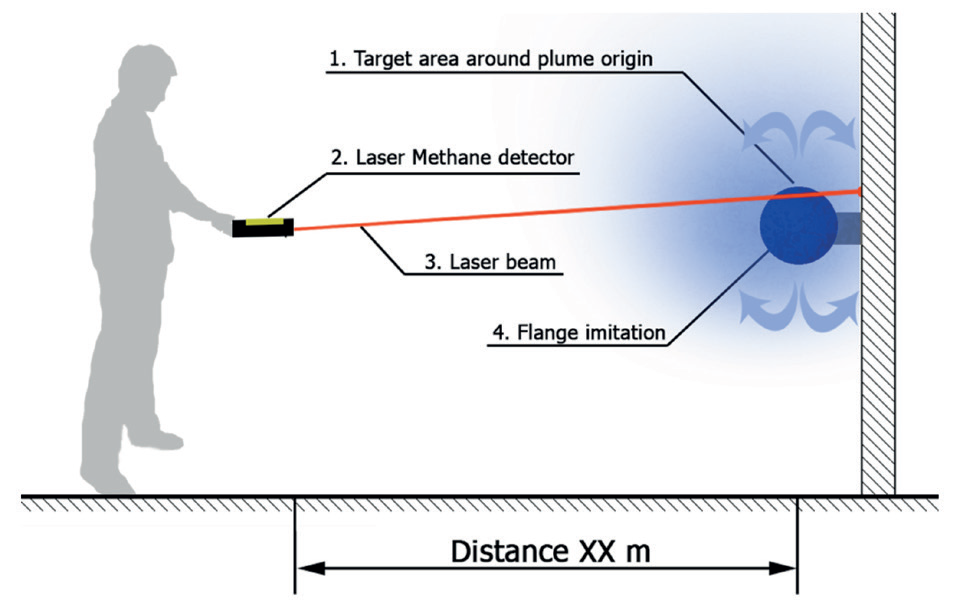
The test stand photo is shown in Figure 1. The test stand scheme is shown in Figure 2.
Stand elements:
- A Gas cylinder with 98% methane equipped with a valve and reducer.
- Gas mass flow rate meter MV-302.
- Handheld TDL detector LaserMethane mini by Tokyo Gas Engineering Solutions. Measurements interval: 1 – 50 000 ppm×m; graduation interval: 1 ppm×m; readings frequency: 2 readings per second.
- Laboratory equipment: a portable table for equipment, measuring tape, wiring, gas cylinder support, a smartphone for recording TDL detector screening data.
Test Design
All measurements are taken at open air to eliminate background methane concentration bias. Measurements were taken during 3 days with mild weather at day 1 and day 2 (temperature 25C, wind from 0 to 3 m/s), and windy weather on the day 3 (temperature 12C, wind up to 6 m/s).
- Measurements are taken with the following parameter space:
a. Leak rates are set according to the leak definition at Table 1: 3, 6, 30, 60 g/h, extended with zero leak 0 g/h and a ‘big leak’ at 100 g/h.
b. Observation distances: ½, 2, 4, 6, 8, 10, 12, 15, 20, 25, 30 m.
c. Controlled leaks are observed at sources imitating a valve and a flange.
2. Each observation is conducted in the following way:
a. Ensure that gas cylinder connected to the controlled leak source through reducer and mass flow meter;
b. Open gas cylinder valve and set gas flow rate; then wait 5-10 seconds to let the gas flow stabilize.
c. Record actual mass flow mereadings.
d. Start taking readings of a TDL detector. Readings are collected for 60 seconds until ~120 data points are collected. Collect data thoroughly as recommending by Method 21 [9].
e. Close gas cylinder valve;
f. Change experiment parameters (distance, leak rate, target source).
g. Repeat for a new observation with new parameters.

Test Results Dataset Description and Data Clean-up
Raw data dataset contains 11,570 readings collected over 95 observations.
As recommended by Method 21,9 the readings are taken thoroughly and then the maximal screening value should be taken. Observations might have outliers (see Figure 3). To exclude these outliers data is smoothed over sliding window before taking the maximum. The width of the window is empirically set to four consequent readings, i.e. approximately two seconds.
For each observation, a smoothed maximum ppmm is calculated as a maximum of sliding window mean values.
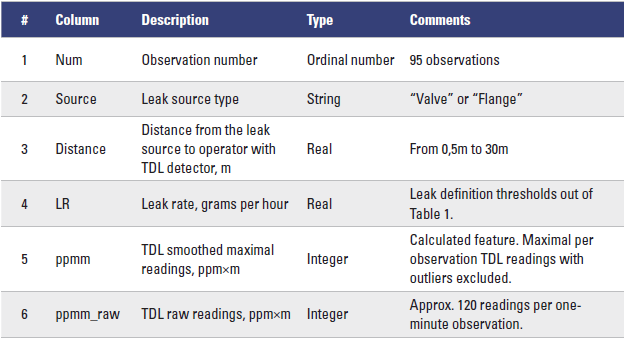
The cleaned-up dataset has one record for each observation, with the following columns (Table 2).
Dataset Exploration and TDL detector threshold suggestion
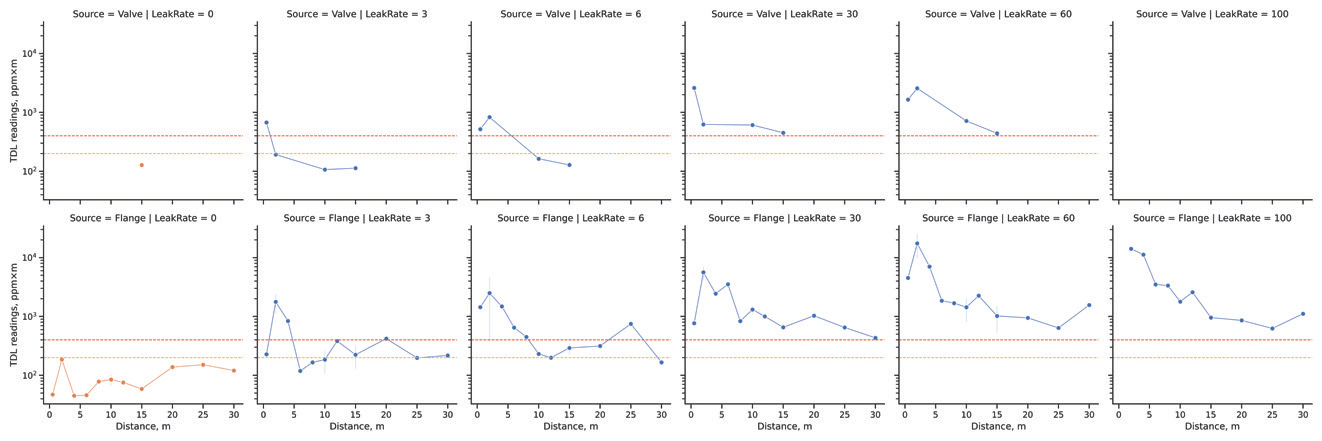
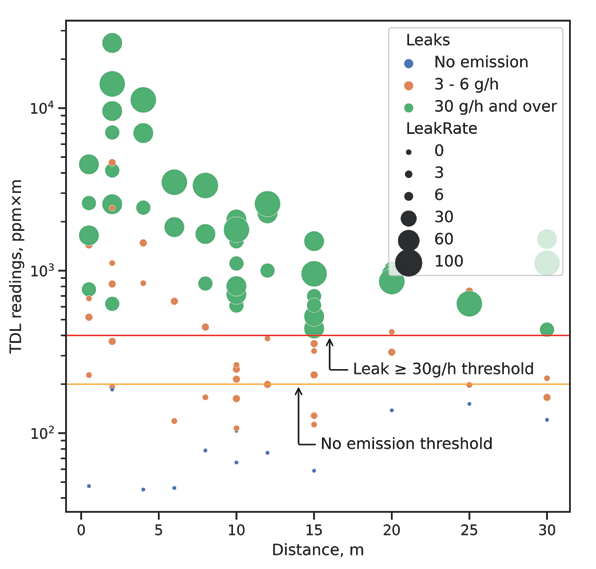
An overview look on the data collected on multiple plots is shown on Figure 4.
Note that TDL detector even for non-leaking sources returns non-zero readings with magnitude from 50 ppm×m up to nearly 200 ppm×m. This could be explained by the ambient methane in the air detected by this high-sensitive tool.
At the leak rates 3 g/h and 6 g/h, TDL readings at distance 5m and more could be less than 200 ppm×m, overlapping with TDL readings for non-leaking sources. That means that small leaks cannot be reliably distinguished from zero-leaks when the operator with TDL detector stands far enough from the source.

For leak rates 30 g/h and 60 g/h TDL detector returns readings over 400 ppm x m at all working distances. That means that these big enough leaks can be reliably detected by TDL operator, when TDL readings threshold is set to 400 ppm×m.
The TDL readings threshold line (red line at Figures 4 and 5) makes a binary classifier for the leak\no-leak binary classification task. The quality of a binary classifier is defined in terms Precision and Recall16. The best quality with Precision = 0.77 and Recall = 1.0 is achieved for the leak rate threshold 30 g/h and over at TDL readings threshold 400 ppm×m for all operating distances up to 30m. Note that it is possible to decrease leak threshold to 6 g/h by decreasing operation distance to 5m, which is not suitable for all facilities.
Conclusion
Handheld TDL gas methane detectors could be suggested as a standalone tool for methane LDAR monitoring. It is possible to operate at distances up to 30 meters, but it is recommended to take the most of the observations at working distance up to 10-15 m, since the TDL detector ability to detect leaks degrades with the distance.
The TDL detector readings threshold, averaged over 2s window time, should be set at 400 ppm×m level. For this threshold leaks with mass rate 30 g/h and over are reliably detected. Some leaks with mass leak rate less than 30 g/h could be missed, especially at long distances.
For the leak emission mass quantification purposes it is recommended to take EFs for leak definition thresholds 30 g/h or 60 g/h from the Table 1. The selection is shown at Table 3. It is suggested that the result, validated experimentally for sources imitating valves and flanges, is valid for all component types.


References:
- BP, “Sustainability report,” 2020.
- Rosneft, “Rosneft Sustainability Report 2020”.
- Equinor, “Sustainability report,” 2020.
- CCAC, “Methane Guiding Principles,” 2017. [Online]. Available: https://www. ccacoalition.org/en/resources/reducing-methane-emissions-across-natural-gas-value-chain-guiding-principles.
- EPA, “Protocol for Emission Leaks Emission Estimates,” 1995.
- API, “Compendium of Greenhouse Gas Emissions Estimation Methodologies for the Oil and Natural Gas Industry,” 2009.
- EU Standards, “EN 15446:2008 Fugitive and diffuse emissions of common concern to industry sectors – Measurement of fugitive emission of vapours generating from equipment and piping leak,” 2008.
- EPA, “Leak Detection and Repair. A best practices guide.,” 2007.
- EPA, “40 CR par 60 Appendix A-7. Reference Method 21, Determination of volatile organic compound leaks, EPA 453/R95-017,” 1981.
- Pajkovic, “Automated Optical Gas Imaging For Continuous Monitoring Of Methane Emissions,” Fugitive Emissions Journal, 2022.
- EPA, “DRAFT Technical Support Document. Optical Gas Imaging Protocol. (40 CFR Part 60, Appendix K),” 2015.
- Lev-On, D. Epperson, J. Siegell and K. Ritter, “Derivation of New Emission Factors for Quantification of Mass Emissions When Using Optical Gas Imaging for Detecting Leaks,” Journal of the Air & Waste Management Association, 2012.
- OGMP, “Technical Guidance Document 2. Fugitives,” 2017. [Online]. Available: https:// www.ccacoalition.org/en/resources/technical-guidance-document-number-2-fugitive-component-and-equipment-leaks.
- Trefiak, “LDAR Case Study Comparison of Conventional Method 21 vs Alternative Work Practice (Optical Gas Imaging),” 2016. [Online]. Available: https://www.epa.gov/ sites/default/files/2016-04/documents/20trefiak.pdf.
- Rosneft, “Official press-release: Rosneft implements complex technology for methane leak detection.,” 2021. [Online]. Available: https://www.rosneft.ru/press/today/ item/204803/.
- Google, “Google Developers Crash-course. Classification: Precision and Recall,” [Online]. Available: https://developers.google.com/machine-learning/crash-course/classification/precision-and-recall.


