Amongst international efforts to address the effects of climate change is the sense of urgency to reduce global emissions. Ambitious emissions reduction goals are being adopted worldwide to combat rising global temperatures, with many countries committing to a net-zero emissions target by 2050. Therefore, efforts to reduce emissions must be accompanied by emissions monitoring and obtaining an accurate measurement of baseline emissions to evaluate the effectiveness of emission reduction strategies.
By Michelle Liu, EIT, M.Eng., Dennis Prince, CEO, P.Eng., M.Sc., Airdar Inc.
Fugitive emissions are unintended releases of gas or vapour and present challenges in many industries. Often, a small number of large leaks, called super-emitters, contribute to a significant portion of overall emissions. This suggests that there is a considerable opportunity to reduce emissions by locating these super-emitting sources. However, the uncertain nature of fugitive emissions presents challenges to emissions monitoring.
Fugitive emissions can occur from pressurized equipment or equipment components such as pipe flanges, valves, and pumps. The challenge is that they can also be found in unexpected locations, making them hard to predict. Adding to this uncertainty is the variability of the emission rate over time; an understanding of this variability is needed to build an accurate emissions profile.
Traditionally, fugitive emissions are monitored in leak detection and repair (LDAR) programs using either Method 21, a methodology developed by the U.S. Environmental Protection Agency (EPA) or optical gas imaging (OGI) cameras. These scheduled inspections are performed a few times a year as required by the regulator using one of these approaches. In Method 21, a sensing instrument is brought directly to every regulated equipment component at the facility to detect a leak. OGI cameras provide a visualization of the emission plume and can be held a few feet from the suspected emission source. However, these methods are considered peri odic approaches and leaks that occur between scheduled inspections could go undetected for a long period of time. These types of directed approaches also introduce confirmation bias since an assumption of where and when a leak will occur must be made to check for leaks. Thus, leaks in unexpected locations are easily missed through periodic approaches. This also means that it is difficult to identify plumes from offsite emission sources that are causing problems for operators at a site using these methods.
More recent developments in emissions monitoring technologies include satellites, drones, vehicle-based monitoring, and aircraft. These technologies are considered indirect approaches since the sensing instrument does not need to be placed near the emission source. This offers the ability to provide emissions monitoring over a large geographical area and reduces the influence of confirmation bias. However, these methods continue to only provide monitoring on a periodic basis, making them still vulnerable to missing leaks.
The challenges of monitoring fugitive emissions have not been fully overcome with traditional and other more advanced technologies. However, this problem has already been solved in the animal kingdom – by a polar bear! A polar bear possesses the remarkable capability of being able to detect a seal from great distances over a vast area. The polar bear’s ability to do this is made possible through its nose, which is continuously detecting plumes from a seal, and its brain, which is continuously processing the collected data. Polar bears do not hunt blindly but are directed by intelligence on the seal’s location obtained by analyzing plumes in the wind. With this capability, the polar bear does not need to approach and smell every hole in the ice to find a seal but can use its sense of smell to guide it to its next meal.


Likewise, a continuous monitoring system can be utilized to locate emission sources that are impacting a facility and provide intelligence to personnel looking for leaks. Using one or more sensors, which are analogous to the nose of the polar bear, concentration data and wind data including wind speed and wind direction are collected. This data is then analyzed using intelligent analytics, which is analogous to the brain. Analytical procedures visualize a plume in the data, find the direction to the source, perform triangulation if multiple sampling points are used, and quantify emissions once the distance to the source is known. There is a real opportunity to save resources being spent to periodically check all components in a facility by instead targeting inspections only to components that are leaking, which are identified through the intelligence provided by continuous monitoring systems.
Quantification of an emission source can be performed similarly to how the flow rate through a pipe is calculated:
- First, find the cross-sectional area of the plume.
- Determine the flux using concentration and wind velocity.
- Obtain the emission rate using the previously calculated cross-sectional area and flux.
Continuous monitoring systems with intelligent analytics have emerged as a promising solution for overcoming the challenges of monitoring fugitive emissions. This approach has been utilized to track various types of compounds including methane, hydrogen sulphide (H2S), benzene, 1,3-butadiene, and mercaptans. The system has been applied in the oil & gas, chemical, wastewater treatment, and waste management industries and has proven to be an effective method for identifying the locations of emitting sources and quantifying fugitive emissions.
The continuous monitoring approach offers several advantages over periodic approaches:
- 24/7 monitoring of all emission sources.
- The ability to monitor emissions at a site without the need for a technician or operator to be present.
- Can monitor any compound for which a detector is available.
- Reduces confirmation bias allowing for both onsite and offsite monitoring coverage.
- Allows facility managers to effectively direct existing resources and enable cost savings by inspecting only the leaking components instead of every piece of equipment, whether it is leaking or not leaking.
The advantages of continuous monitoring in overcoming the challenges of monitoring fugitive emissions will be further demonstrated through the following two case studies at a midstream and an upstream oil and gas facility.


Case Study 1: Detecting Fugitive Emissions at a Gas Plant
At a midstream oil & gas facility located in Canada, a continuous monitoring system consisting of two sampling locations connected to a central instrument was set up to monitor total hydrocarbon (THC) levels. After a couple of months of monitoring and collecting data, the system identified several important emission sources. These included sources at the tanks, an unexpected source at the compressor station, and an offsite source that was causing issues at the gas plant. Upon further investigation, it was discovered that this offsite source was a sour gas well owned by a neighbouring operator. Odorous plumes from this offsite source would blow onsite as the wind changed directions. This caused confusion for the operators as they believed the issue was coming from within the gas plant. With this information, they were able to contact their neighbouring operator to address emissions coming from the sour gas well.
An initial investigation using handheld detectors could not locate the unexpected emission source at the compressor building. However, the monitoring system continued to indicate a leak present in that area. A second investigation of the compressor building was performed and eventually, a vent approximately 1.2 m off the top of the compressor building was found to be the source. Instead of discharging pure air, the vent was found to be releasing 4% air and 96% THC, which was composed of 94% methane. Initially, operators were not able to find the leak as only one side of the building was inspected. It was assumed that a leak would most likely occur in this area, which introduced confirmation bias during the inspection.
From this case study, one can see that emissions can occur in unexpected locations. Normally, components located in areas that are difficult to access are deferred in an LDAR program. Without the capability of the continuous monitoring system to provide unbiased, sitewide monitoring of all equipment, the emission event occurring at this vent could have gone undetected for a while.
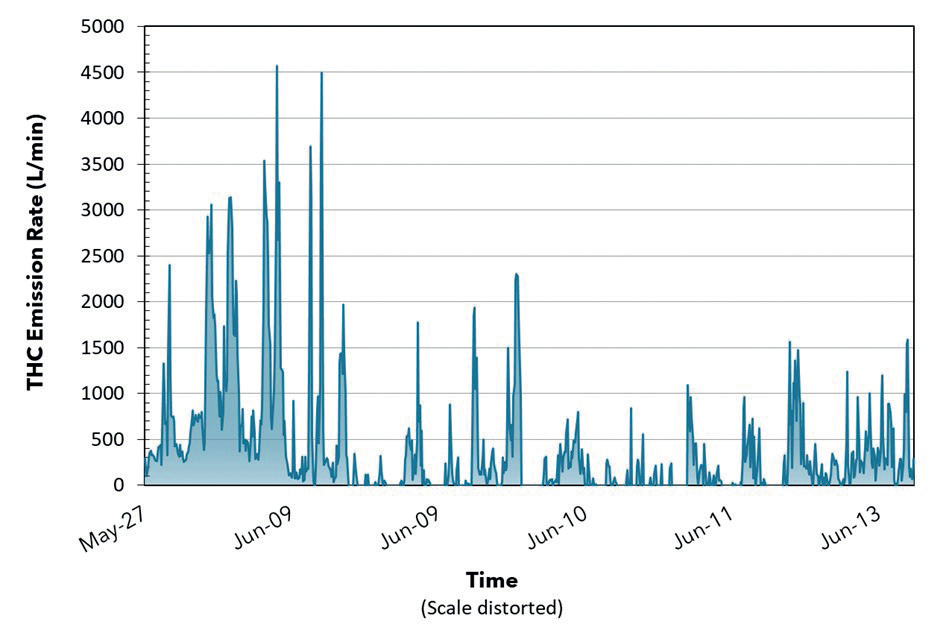
The continuous monitoring system is also able to capture the variability in the emission rate over time. This feature allows operators to evaluate the effectiveness of implemented mitigation strategies. Here, changes were made to the facility’s operations to reduce the frequency of venting at the tanks. As shown in Figure 1, these improvements saw a noticeable decrease in emissions from the tanks starting around June 9. The continuous monitoring system provides valuable information to demonstrate the success of implemented mitigation strategies.
Case Study 2: Odour Concerns at a Steam- Assisted Gravity Drainage (SAGD) Facility
A SAGD facility was experiencing odour issues related to high levels of H2S. Known sources of emissions were identified including the hot lime softener (HLS) system. A costly intervention was being considered that would involve tying the vent of the HLS system to the flare to burn the steam containing H2S that was coming from the HLS system. Before going ahead with its implementation, facility managers wanted to be certain that this intervention would solve the odour issues. A continuous emissions monitoring system measuring both THC and H2S levels was implemented to better understand the baseline profile of emissions at the site. The system consisted of a high-end instrument centrally located within the facility with several remote sample inlets connected to the system through tubing as shown in Figure 2.
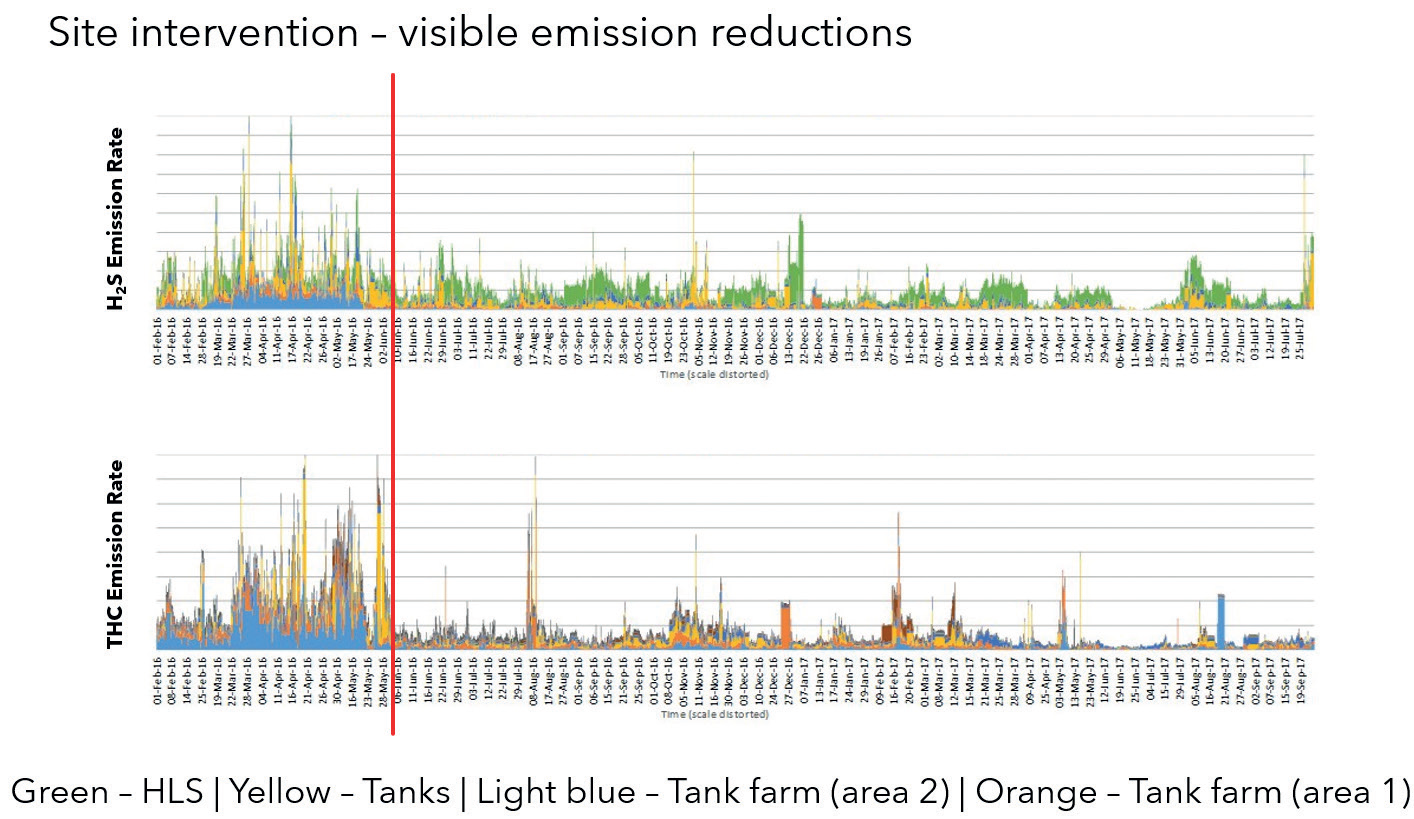
After a period of monitoring, important emission sources affecting the facility were identified. Unsurprisingly, the HLS system was identified as an important source. Other major sources of emissions that were identified included the tanks and an unexpected offsite source at their wastewater treatment plant located just outside the perimeter of the facility. Overall emission rates were obtained and showed that the HLS system was not the most significant source of emissions. Instead, the tanks were the largest cause of emissions, sometimes venting as much as 1,000 times their normal rate. With this information, interventions were made by strengthening the structures of the tanks to allow for less frequent venting. This produced a significant reduction in emissions as can be seen in Figure 3. The continuous monitoring system provided managers with information to make an informed decision on which mitigation strategy was the most appropriate.
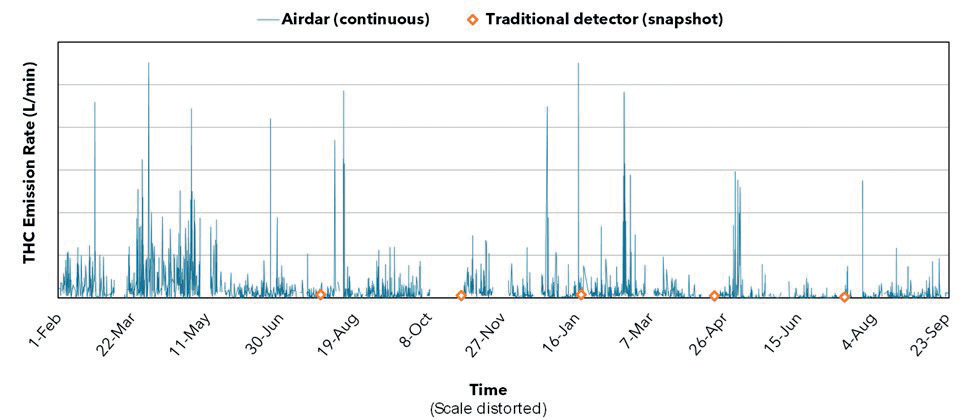
Periodic monitoring approaches fail to capture the emission rate variability over time. Figure 4 shows the emission rate of a single tank observed by the continuous monitoring system and five periodic measurements taken by a hi-flow sampler over the same 18-month monitoring period. As can be seen, the quantification performed with a hi-flow sampler matched the emission rate determined by the continuous monitoring system at the time of the periodic measurements. However, when the technicians were not onsite for such a survey, large spikes in the emission rates were missed by the periodic approach.
Capturing these spikes offers important information on the site’s overall emissions profile. The average emission rate measured by the continuous monitoring system was five to seven times larger than snapshot readings taken by the hi-flow sampler because of these intermittent spikes.


Conclusion
With emissions at the forefront of major global issues, knowing and measuring emissions is becoming increasingly important. Continuous monitoring with data analytics is providing information about emissions that were once unknown and thought not possible to determine. The exact location of an emission source and its emission rate over time can be calculated by collecting air concentration and wind velocity data.
With this data, baseline emissions and key emission sources for an entire site can be defined and provide operators with actionable information to further improve their operations. Continuous monitoring offers distinct advantages over traditional methods (LDAR and OGI cameras) and other periodic approaches (aircraft and satellites), making it a powerful tool for effectively managing emissions.


